
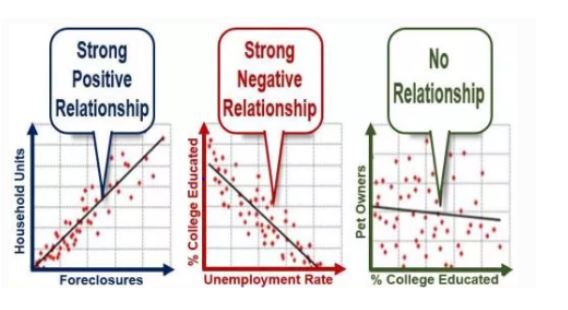
Regression analysis is a statistical technique used for determining the relationships between the criterion variable or the dependent variables with the one or more independent variables. Regression helps to understand the changes in the independent variable due to dependent variables. The uses or the advantage of using regression analysis are trend forecasting, determining the impact of predictors also forecasting the effect. It also helps to determine the change in independent variable due to the conditional expectation of dependent variables.
Today, many companies use regression analysis to understand and predict the sales in the future. For example, if you think drugs might influence businesses, you will require data for the preceding three years. Use the data then plot a graph depicting the sales. By performing this technique, the decision-makers come with a plan or strategy to grow their business.
Besides being employed in businesses, regression technique, a working horse in statistics, is used in academics to test the hypothesis, determining the strength of predictors, etc. Some of the most popular regression techniques used in academics are:
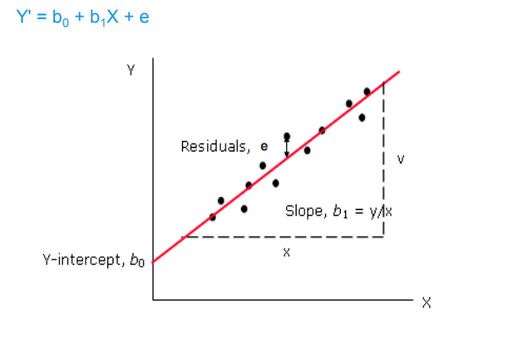
LINEAR REGRESSION
Linear regression is primarily used in predictive analysis. It is a linear approach used for modeling the relationship between the dependent variable and multiple predictor or independent variable. It focuses on the conditional probability of the responses.
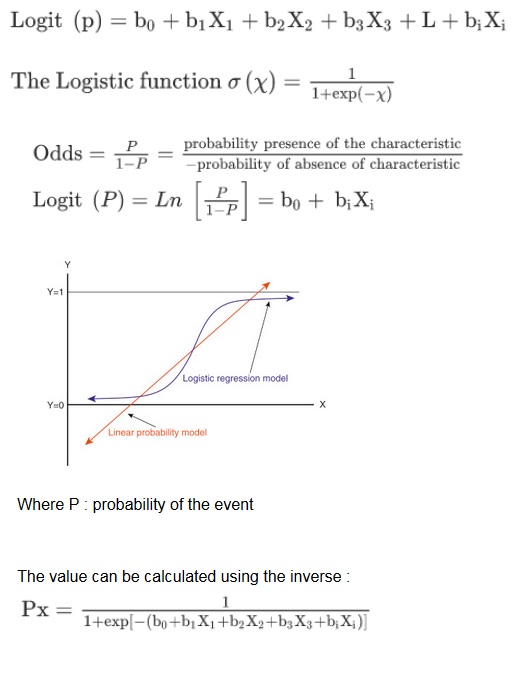
LOGISTICS REGRESSION
Logistic regression is a technique used to predict a categorical variable. It is a case of GLM models that predicts the probability of the variables with the help of binomial logistic regression we can also predict the binary outcome. Similarly we can also predict multiclass response using multinomial logistic regression.The logistics regression follow an S-shaped graph. However, mostly, the dependent variable is a dichotomous variable i.e., 0 or 1.
Where P : probability of the event
The value can be calculated using the inverse :
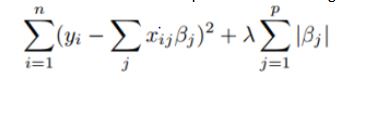
LASSO REGRESSION :
It is regression method that involves shrinkage of data.shrinkage is where data are shrunk in away that they are placed by means. This regression are particularly applied when models show a high level of correlation ie. multicollinearity. The LASSO means “ Least Absolute Shrinkage and Selection Operator”. The objective of LASSO regression is the sum of constraints Bj to zero which makes the interpretation of the model relatively easier to understand and comprehend. It uses quadratic programming which can be best solved using MATLAB software. The equation for Lasso regression is given by,
Key takeaways :
Case1: When λ = 0, no parameters are eliminated. It is similar to linear regression.
Case 2: With the increase in λ, the biases of the sample increases. It also set all the coefficients to zero and then they are eliminated to make it more interpretable.
Case 3: When λ decreases, the variance increases.
RIDGE REGRESSION
It’s a type of regression that helps in analysing the data that has more number of predictors than observations. Its perform on the data that has multicollinearity. Due to high number of predictors in the data the number variance in the data is so large which could be way more than the actual value also least squares estimates are unbiased. The ridge regression reduces the standard error by adding the degree of bias so that the net effect will give estimates that would be more accurate and reliable. Ridge regression uses shrinkage estimator as ridge estimator. This estimator is then used to improve the least square estimates as the data has multicollinearity. The ridge regression particularly used when the equation has no unique solution this is a typical example of machine learning. It helps in preventing the underfitting and overfitting of the data by adding penalising term.
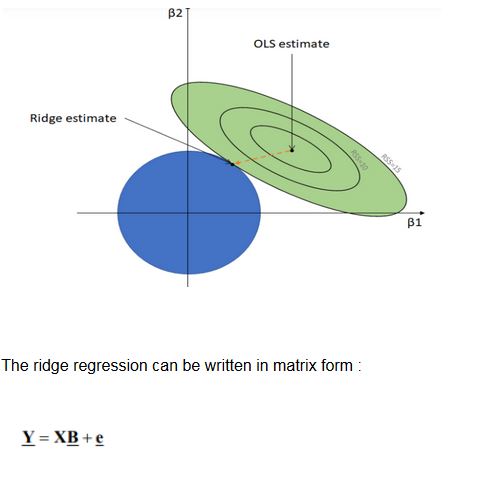
Where ‘Y’ is dependent variable
‘ X’ is the independent variables,
‘B’ is the regression coefficients that has to be estimated
‘e’ errors are residuals
Now that you know about various regression techniques, considering your data, choose the right method & software and triumph the data analysis process.